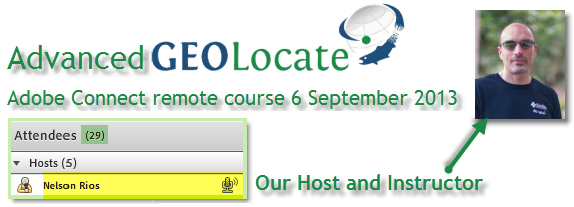
 On Friday, September 6th, Nelson Rios from Tulane University and the FishNet2 project, presented a lecture covering advanced use of GEOLocate software and services available through the web-based Application Programming Interface (API). Using Adobe Connect meeting software, over 30 people came to find out what they can do with GEOLocate tools and services beyond the online public user-interface. The recorded meeting was IT-oriented, but those new to "just what is a service?" were also welcome. Many of the participants were from the recent iDigBio 2nd Train-the-Trainers Georeferencing Workshop and they were eager to pick-up where the TTT2 GEOLocate material ended. (TTT2 Workshop) (TTT2 Blog)
Nelson began with an introduction to GEOLocate Web Services and the core georeferencing engine. The core engine is what takes textual locality data and tries to deduce possible geographic coordinates. He described SOAP and RESTful web service architectures to access the core engine and gave an example of consuming JSON output from the REST interface. Simple Object Access Protocol (SOAP) and Representational State Transfer (REST) define protocols (methods) for accessing a service. JavaScript Object Notation (JSON) is a data-interchange format – easy for humans to read and write and easy for machines to generate and parse.
Nelson described available input parameters for each service and demonstrated using cURL (Client for URL (cURL) to send an HTTP Get request (URL string) to the service and display the JSON formatted output. cURL is a simple command line tool for sending and receiving http requests. HTTP Get Request examples of what parameters can be put into a URL call to GEOLocate services and output formats can be found at “How to craft urls”.
After explaining cURL, he introduced the R programming language, RStudio (a GUI Interface for R – available for Windows, Mac, and Linux) and demonstrated how to access GEOLocate web services from RStudio. (From the R project site: "R is a language and environment for statistical computing and graphics. R provides a wide variety of statistical (linear and nonlinear modelling, classical statistical tests, time-series analysis, classification, clustering, ...) and graphical techniques, and is highly extensible").
If you'd like to try this yourself, first, watch the video. Download R (it's open source) and then head over to GEOLocate and click the header link to Developer Resources and try out RStudio using the sample input file. In this case, the example involves batch processing localities and manipulating the data returned by GEOLocate. For instance, Nelson demonstrated how the localities returned are ranked, each receiving a precision score. This score can easily be used to separate localities into those with high, medium and low scores. One might envision a automated-workflow where the resulting georeference of a given locality receiving a high score is accepted, those localities receiving a medium or low score would go to humans for georeferencing.
After our crash course in R using RStudio, Nelson mentioned how almost all components of GEOLocate have an accessible API including the entire GEOLocate web client. He showed everyone how they might, if desired, embed GEOLocate into their own web applications. It's great to see that when you do this and you "call" GEOLocate services, the data you get back is saved to your (so-called "parent") application that called the service in the first place. Cool! One interesting newer feature Nelson revealed is the ability to add to an existing, customizable gazetteer using this embeddable client. Contact Nelson for more info if you might be interested in using this feature.
At this point, the discussion changed to broader workflow issues. Are you georeferencing one-record-at-a-time? Are you batch-georeferencing? Are volunteers and citizen scientists georeferencing locality records through the collaborative georeferencing website? Each project has unique needs and idiosyncrasies when it comes to georeferencing. The more records that can be geocoded automatically, the better (cheaper and faster!). From the on-going FishNet2 project, Nelson showed us that many locality records might match previously georeferenced records. In the current project, approximately 20% matched – that's 20% fewer records they'll need someone to work on. The message here is, figure out how to compare your localities to known (georeferenced localities) to automate the process as much as possible.

What makes human georeferencing go faster? Familiarity, experience, and meaningful record sets are three factors you can use when designing a georeferencing project. Subdivide and conquer - create manageable record sets from your data that leverage the existing expertise in a given region or collection and try to identify similarities among individual records to minimize duplicated effort. The FishNet2 project is actively georeferencing over 1.5 million specimens (equivalent to 350,000 collecting events) using the collaborative georeferencing architecture of GEOLocate. Nelson showed us graphically, what to expect using data from the first 6 months of georeferencing collaboratively with up to 12 technicians.
Focus on how many localities need georeferencing, instead of the number of specimens. If possible, use an infrastructure that makes it possible to group localities together, or group specimens together by locality first. This keeps you from having to re-georeference the same locality over and over again (saving $ and time).
If you'd like to know more about GEOLocate Web Clients / Services / Embedding - send Nelson an email. If you'd like to know more about the iDigBio Georeferencing Working Group (GWG) and how you can get involved, send anyone in the GWG a note. If you'd like to suggest a topic for an online course - please click the feedback button on the right side of your screen.
See you at our next Adobe Connect online course…
(by Deb Paul and Nelson Rios)


