Collecting trends: how wars and human history influence biological collections
-- Contributed by Vaughn Shirey, The Academy of Natural Sciences of Drexel University
A large portion of my research in The Gelhaus Lab at The Academy of Natural Sciences of Drexel University relies heavily on digitized specimen data and metadata, specifically the who, when, and where of specimen collection. “Big data” research has risen in popularity since high-performance computing has made it easier for researchers to conduct analyses of groups of organisms overnight; however, additional considerations to the use of large datasets should be taken into account. My research focuses on the historical biases present in natural history collection data, including identifying collection bias and gaps in data due to human history. Coupling these approaches with interactive visualization aids helps to weave a story about the development of entire natural history collections.
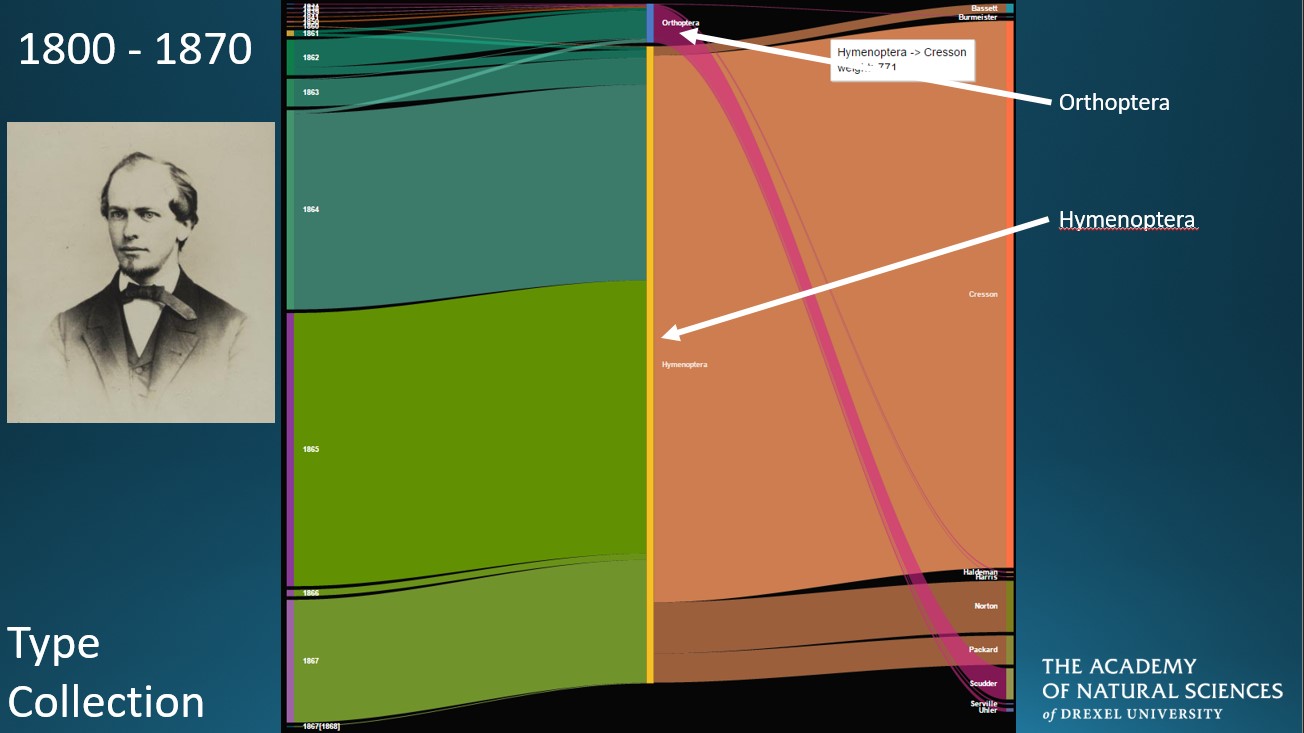
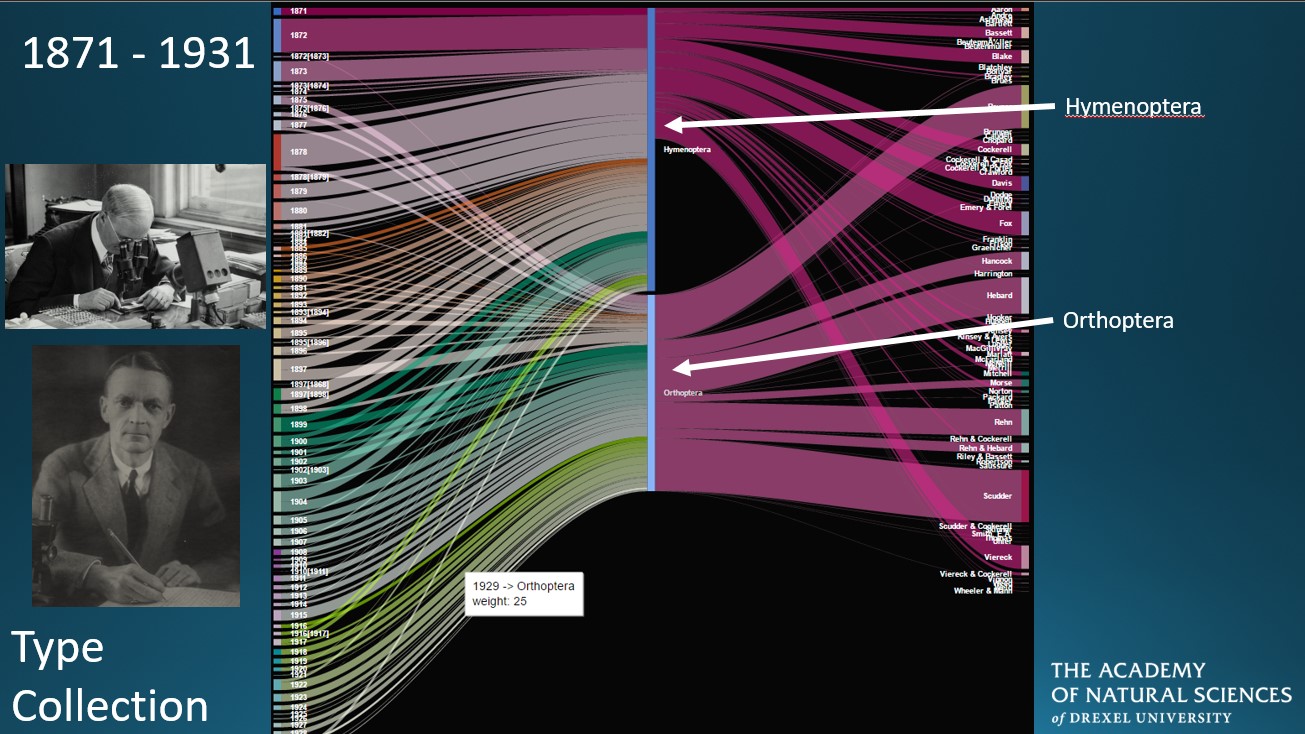
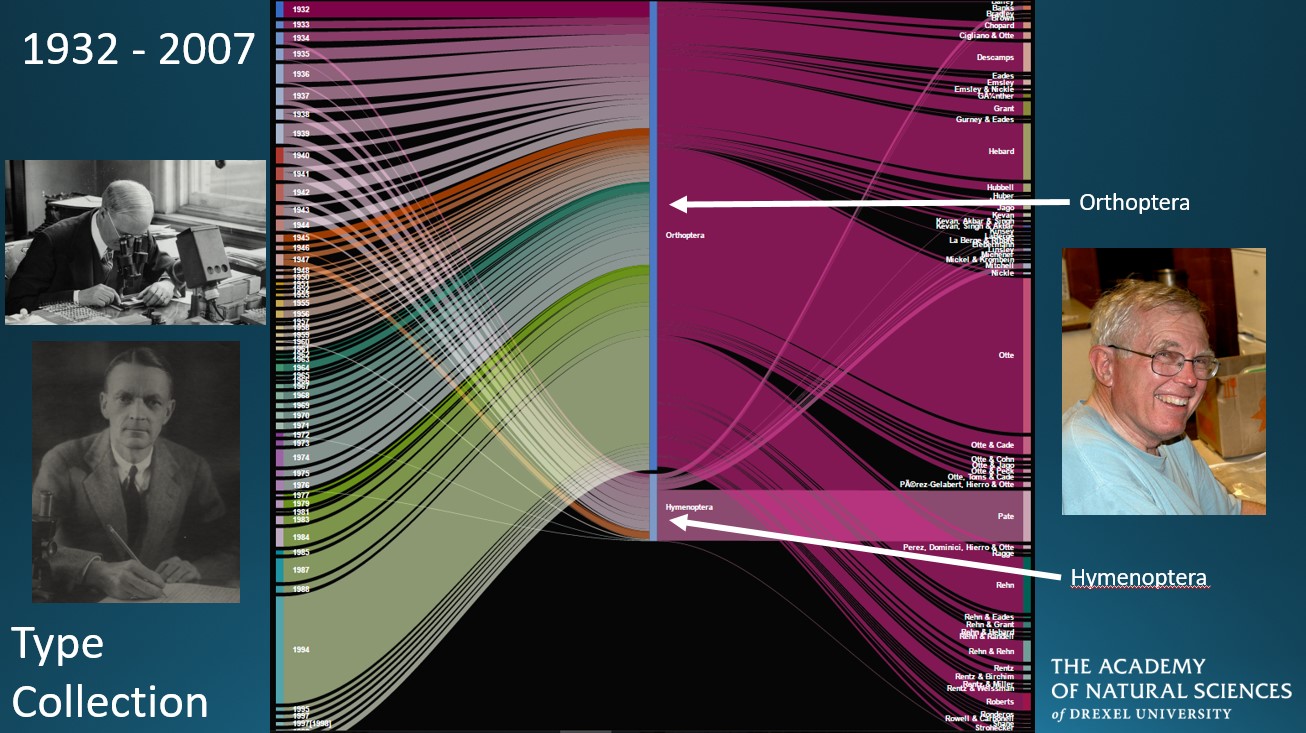
As a proxy for our main insect collection (which is actively being digitized), our type collection (those specimens on which taxonomic names are based) correlates strongly with the history of scientists at The Academy. Our type collection contains over 11,000 type specimens of mostly Orthoptera (grasshoppers, crickets, and katydids) and Hymenoptera (ants, bees, and wasps). I programmed an interactive Sankey Diagram, a type of flow diagram, to explore these trends by author, the years in which the author was active, and insect order. By adjusting various variable sliders, we can trace the development of the type collection throughout its entire history. The width of individual connections in the Sankey Diagram represents the number of specimens represented by a connection. Interactive applications like these allow for further exploration of the type collection by the independent selection of variables such as taxonomic order and year.
Figure 1. Composition of the type collection from 1800-1870, most notably Hymenoptera with large contributions from Ezra Cresson (top left photo). Orthoptera represents only a small fraction of the types. (Click on the image to increase the size.)
Figure 2. Contributions to the type collection from 1871-1931. Hymenoptera and Orthopera are on equal footing as far as the number of specimens added. Large contributors to Orthoptera include A.G. Rehn (top left photo) and Morgan Hebard (bottom left photo).
Figure 3. From 1932-2007, Orthoptera dominates the type collection with major contributions by Dan Otte (right photo).
While insights into one sub-collection of the larger entomology collection are valuable, I was curious to see if history had an impact on specimen collection and our knowledge of certain groups during a particular time. Starting small, I worked with The Academy’s insect collection data and noted a large dip in collection frequency around World War II (WWII - 1939-1945). Unsurprisingly, a mirrored decrease in specimen collection occurs in insect data found within the iDigBio Portal. I specifically used insect datasets from The American Museum of Natural History, Field Museum of Natural History, and Yale Peabody Museum, with approximately 1.5-million records. Figure 4 shows the complementary decreases in specimen collection during the period in question.
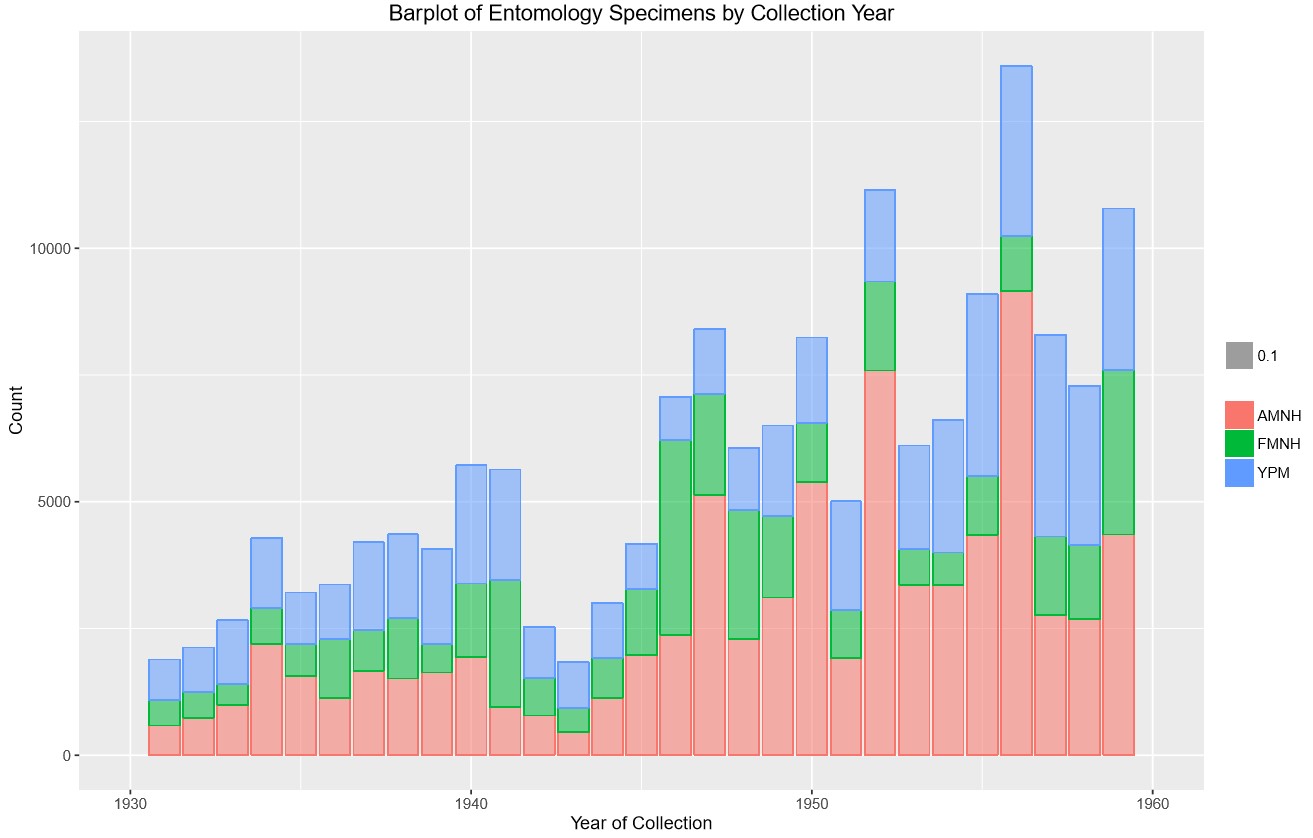
Figure 4. Decrease in specimen collection during American involvement in WWII shown throughout three major collections.
While interesting, it’s not enough to go on numbers alone, so I consulted The Academy archives for possible insight into these trends. I found an address in 1941 by the Academy’s president to the museum’s membership that notes a limited scope of new specimen collection during the war.

Figure 5. Excerpt from archival material highlighting the impact of WWII on specimen collection [Coll #990, Box 6, Folder 82].
It’s important to note these biases prior to conducting research on large datasets as they represent gaps in our knowledge. Simple techniques in visualization can help to elucidate these gaps and provide insight on how they might be resolved. What might these trends look like when applied to the entire iDigBio dataset?
Click here (https://www.idigbio.org/portal/search/records?rq={"institutioncode":"ANSP","phylum":"arthropoda"}) to see the arthropod collections from The Academy of Natural Sciences of Drexel University shared by iDigBio.
Special thanks to the library and archives staff at The Academy of Natural Sciences for helping me seek out material and providing scans, and to Dr. Jon Gelhaus, Greg Cowper, Jason Weintraub and Steve Dilliplane for insight and research support.


