Research Spotlight: June 2017
Hole-y Plant Databases! Understanding and Preventing Biases in Botanical Big Data
Humans have been collecting and preserving plants across the globe for hundreds of years, and patterns drawn from aggregated specimen records can teach us many things about the natural world. For example, my thesis research focuses on how plants with different traits shift their flowering times in response to climate. Unfortunately, datasets of herbarium records may not always constitute a random sample—the statistical ideal for conducting many analyses—because specimens have been collected according to the interests, needs, and preferences of specimen collectors. These preferences could lead to systematic sampling biases, which could then limit our ability to discover biologically meaningful trends. Thus, as part of my research, I decided to investigate the types and extent of biases in herbarium collections.
First, I reviewed the scientific literature regarding biases in natural history collections, and I discovered over 95 reports of biases from over 80 studies. These biases could be parsed into four major “classes”: geographical, temporal, individual, and species-level (Table 1), and each could have different effects on downstream analyses. Importantly, I also noticed how different these biases could be depending on the dataset. For example, one study found a bias toward more populated areas (Aikio et al. 2010), while another discovered a bias against densely populated areas (Yang et al. 2014). It was the context of the collection (New Zealand vs. China) that made the difference in how these datasets were aggregated over time and, ultimately, in what biases arose in the data.
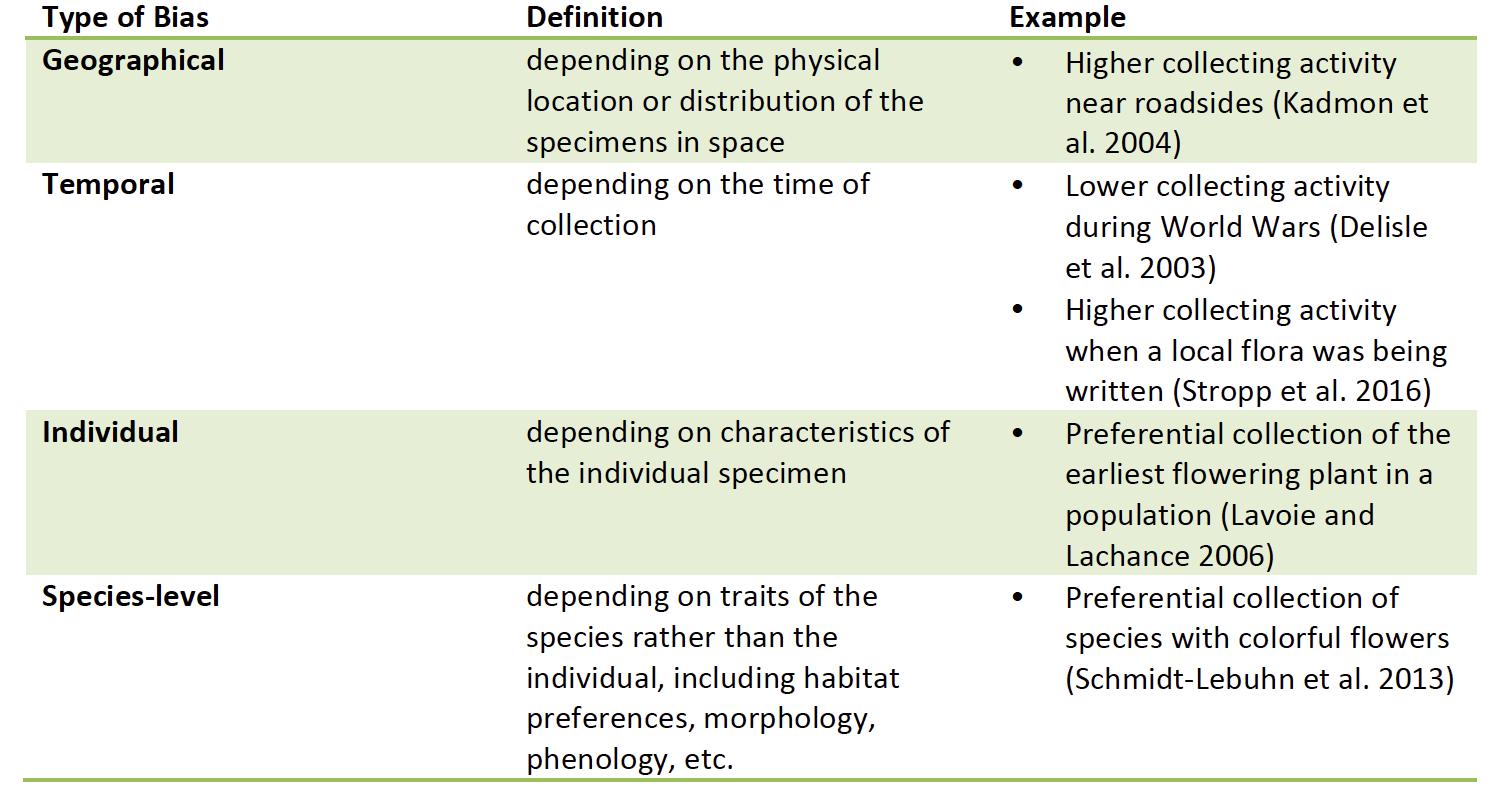 |
Table 1: Definitions and examples of classes of biases discovered in biodiversity specimen collections in over 80 scientific studies |
To further investigate the context-dependence of biases in herbarium datasets, I decided to run my own analyses on two disparate datasets. One dataset comprised all Asteraceae (sunflower family) specimens on the iDigBio portal collected in Colorado (USA), and the other dataset included all Asteraceae specimens on the iDigBio portal collected in the U.S. Southeast Gulf Coastal Plain ecoregion (Figure 1). After some extensive data cleaning, the datasets were approximately equal in size (~70,000) and well-represented the high biodiversity in these two regions.
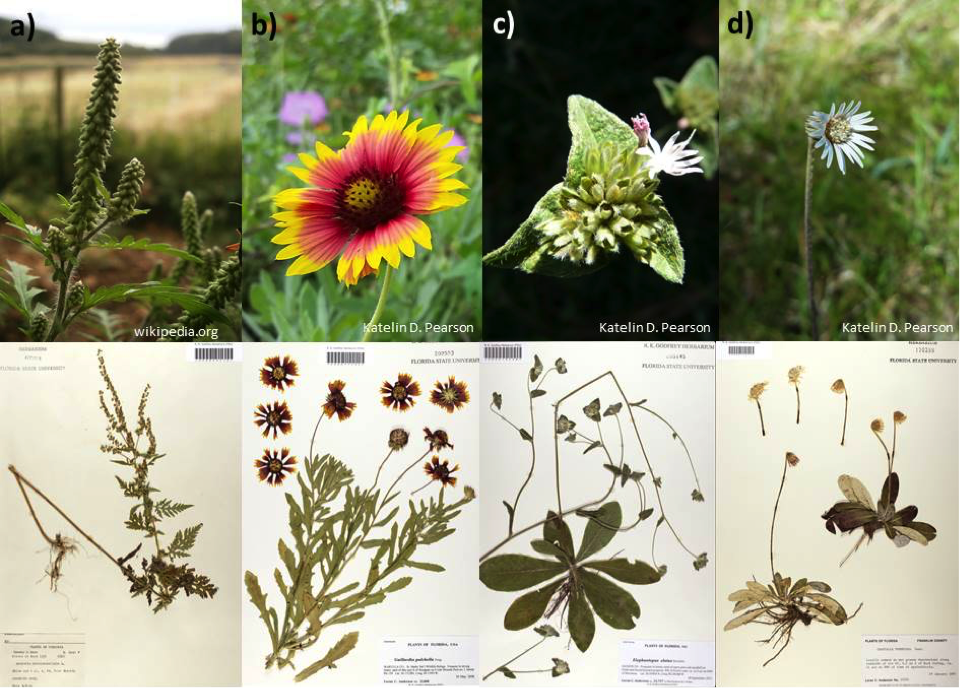 |
Figure 1: Examples of Asteraceae species in the U.S. Southeast Coastal Plains in the field (top) and as herbarium specimens (bottom). Species shown are (left to right): Ambrosia artemisiifolia, Gaillardia pulchella, Elephantopus elatus, and Chaptalia tomentosa. |
Testing for biases essentially requires comparing a dataset to some measure of biological reality; however, this process becomes complicated in the case of biodiversity specimen databases because we rarely have a better measure of biological reality than the specimens themselves. To account for this, I followed the lead of Schmidt-Lebuhn et al. 2013 and used computer simulations. I wrote R code that generates 10,000 specimen datasets in which the probability of collecting a specimen of a given species is proportional to the level of collecting activity within the species’ geographical distribution within the original dataset. This method takes into account the inescapable geographical bias in my original datasets while still producing simulated datasets that are agnostic of species traits (i.e., random). I ran a separate simulation for each dataset, and for each, I then compared the simulated number of collections of species with certain traits to the actual number of collections of those species in the real dataset (Figure 2). Major discrepancies between these values indicate a bias toward or against those species.
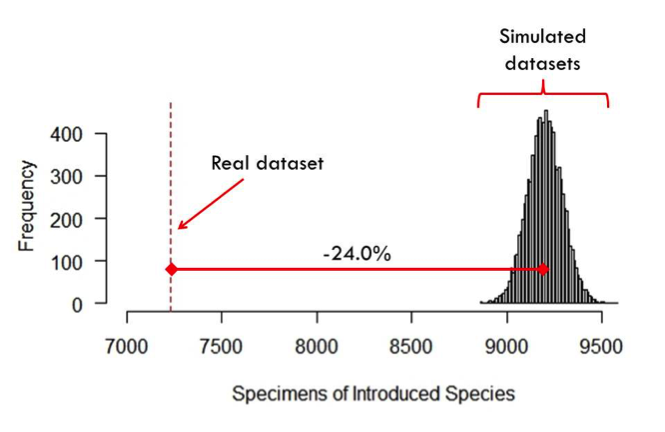 |
Figure 2: Comparison of the number of specimens of introduced species in simulated datasets based on the Southeast U.S. dataset (right) and the actual number of specimens of introduced species (dashed vertical line). The difference between these two numbers indicates a remarkable 24% bias against introduced species in this region. |
I tested for biases in a variety of traits including size, season of flowering, and habitat preferences, and the results were striking (Figure 3). In the U.S. Southeast Coastal Plain, there were strong biases against collecting introduced species (-24%) and species that occur at higher elevations (-16.4%), and there were biases toward summer-flowering species (+7.5%), species that flowered for longer than six months (6.9%), low elevation species (4.0%), and species that grow in dry habitats (3.7%).
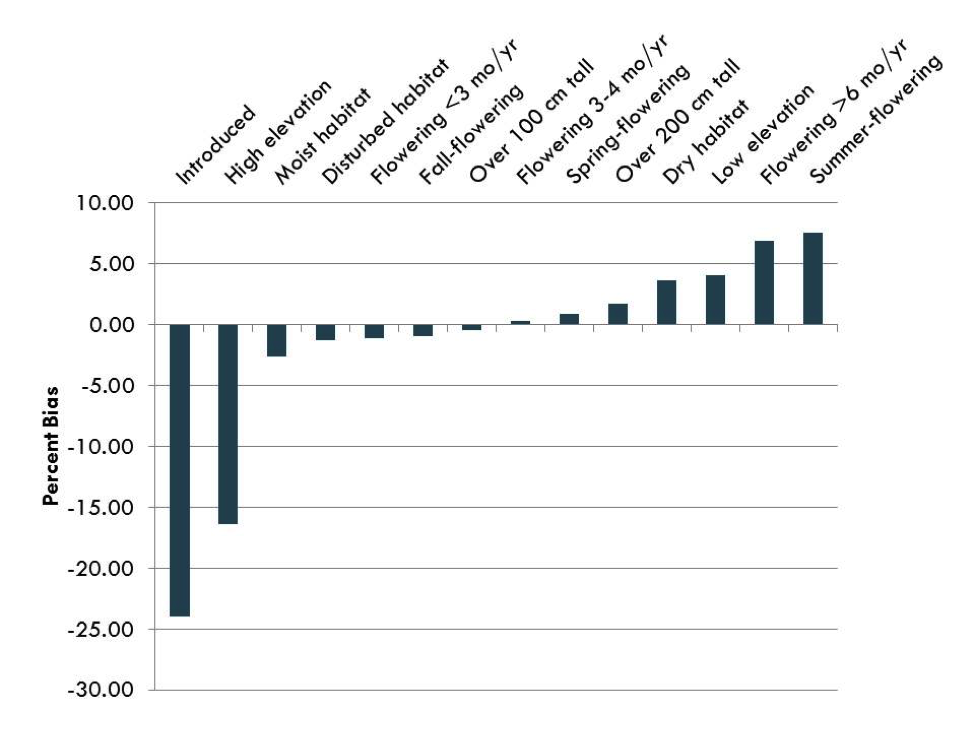 |
Figure 3: Species-level biases discovered in a dataset of Asteraceae in the U.S. Southeast Coastal Plain Asteraceae |
The biggest revelation came when I compared biases between the Colorado and U.S. Southeast datasets (Figure 4). The two datasets shared a strong bias against introduced species and a strong to moderate bias toward summer-flowering species, but that was the extent of the similarity. Several traits, such as low elevation and flowering for longer than six months, showed positive biases in the U.S Southeast, yet strong negative biases in Colorado. Others shared the direction of bias, but differed greatly in magnitude. For example, a small, 0.9%, bias toward spring-flowering species existed in the U.S. Southeast, while the bias toward these species in Colorado was a whopping 31.2%. Similarly to what I had found in my literature review, my analyses revealed that biases can indeed vary widely between datasets.
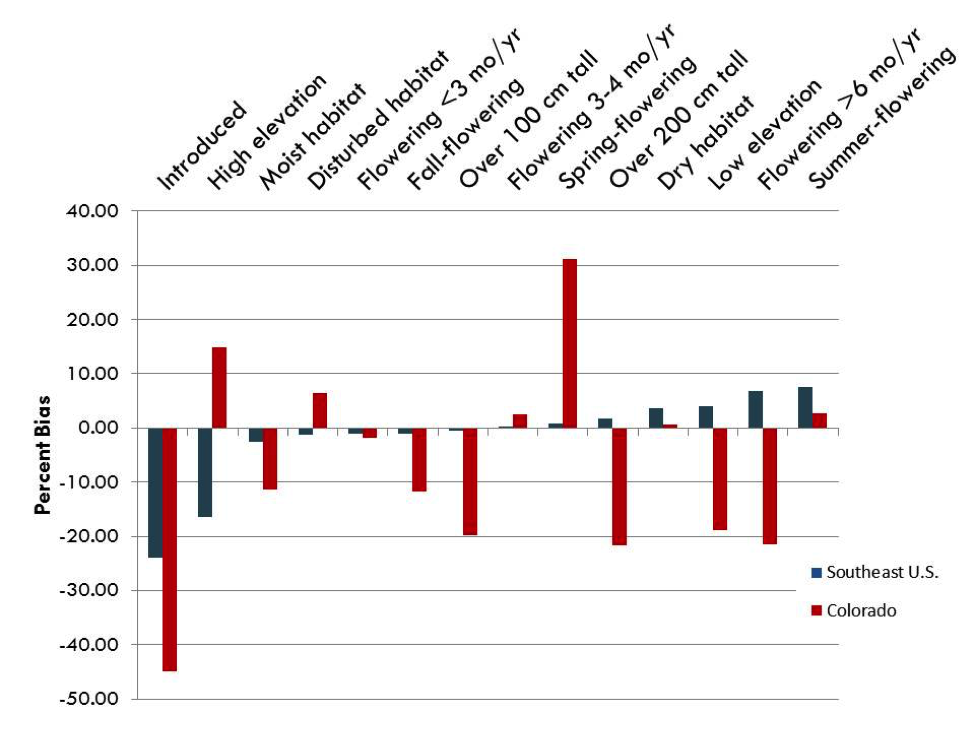 |
Figure 4: Species-level biases discovered in herbarium datasets of the Asteraceae in the U.S. Southeast Coastal Plain (blue) and Asteraceae of Colorado Asteraceae (red) |
These results underscore a key message for those working with biodiversity data: know your dataset. Data users should understand how biodiversity specimens are collected and, if possible, what biases could have arisen in their particular dataset. For example, the production of a local flora could have boosted collections during a certain time period (temporal bias), or a prolific local collector could have specialized on certain taxa (species-level bias). Checking the dataset for biases that may affect your specific analysis is also an important step the data acquisition and cleaning process. When significant biases are identified, a variety of methods can be utilized to account for them such as including data from other sources or using statistical models.
Finally, these analyses provide a way forward for data providers—specimen collectors—by highlighting gaps that could be addressed by focused collecting efforts in the present and improving collecting practices in the future. As both a data user and a provider, I have learned much from delving into the complexities of the data, and by sharing I hope to inspire others to do the same.
This research was presented at the Digital Data in Biodiversity Research conference in Ann Arbor, MI on June 6, 2017. A recording of the presentation can be found here [1].
Katie Pearson [2] is a graduate student in the lab of Austin Mast at the Florida State University and current graduate curator of the R. K. Godfrey Herbarium [3].
Works cited:
Aikio S, Duncan RP, Hulme PE. 2010. Herbarium records identify the role of long-distance spread in the spatial distribution of alien plants in New Zealand. Journal of Biogeography. 37:1740-1751.
Delisle F, Lavoie C, Jean M, Lachance D. 2003. Reconstructing the spread of invasive plants: taking into account biases associated with herbarium specimens. Journal of Biogeography. 30:1033-1042.
Kadmon R, Farber O, Danin A. 2004. Effect of roadside bias on the accuracy of predictive maps produced by bioclimatic models. Ecological Applications. 14(2):401-413.
Lavoie C, Lachance D. 2013. A new herbarium-based method for reconstructing the phenology of plant species across large areas. American Journal of Botany 93(4):512-516.
Schmidt-Lebuhn AN, Knerr NJ, Kessler M. 2013. Non-geographic collecting biases in herbarium specimens of Australian daisies (Asteraceae). Biodiversity Conservation. 22:905-919.
Stropp J, Ladle RJ, Malhado ACM, Hortal J, Gaffuri J, Temperley WH, Skøien JO, Mayaux P. 2016. Mapping ignorance: 300 years of collecting flowering plants in Africa. Global Ecology and Biogeography. 25:1085-1096.
Yang W, Ma K, Kreft H. 2014. Environmental and socio-economic factors shaping the geography of floristic collections in China. Global Ecology and Biogeography. 23:1284-1292.